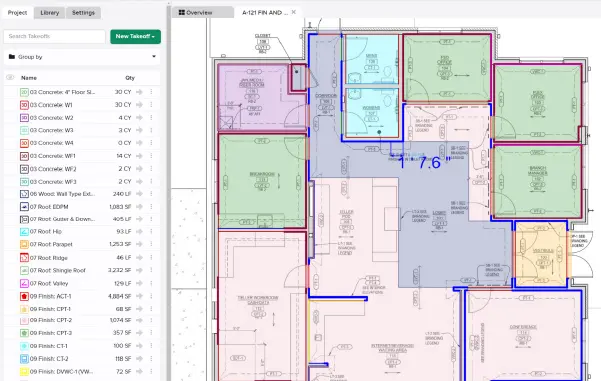
You can now edit Assembly Inputs like Item Group choices and values for custom variables directly inside the Estimate Worksheet. For more information, visit our Help Center.


STACK and Velixo launch STACK for Excel, an exclusive integration connecting takeoff and estimating data directly in Excel.

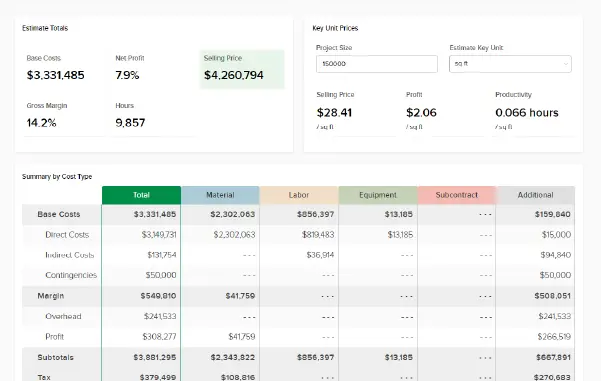
Consistent estimating accuracy builds confidence, speeds up bidding, and drives more profitable wins. STACK customers are proving this every day with higher win rates and revenue growth.